Intra-seasonal South-West Monsoon Extreme Variability of Wet and Dry spells is driven by World Dam Dynamics.
By Ramaswami Ashok Kumar, B.E.,M.E., Negentropist,
Bombay Sarvodaya Mandal, 299, Tardeo Road, Nana Chowk, Mumbai-400007.
© 2022 Ramaswami Ashok Kumar
Invocation
broohi mukundeti
https://www.youtube.com/watch?v=31vQFHBhJoQ
There is true knowledge, learn thou it is this:
To see one changeless life in all the lives, in the separate, the inseparable.
There is imperfect knowledge: To see the separate existences apart,
And seeing them apart, to hold that to be true.
And there is false knowledge:
To cling to one as if it were all,
Heedless of the consequences, heedless of the harm,
Narrow, dull and dark.
---- Timeless and Authorless, The Bhagavad Gita,
Edwin Arnold in the Song Celestial.
1. DON’T MISTAKE THE GHGs FOR THE DAMS(10a,12,13,14,15)
2. The
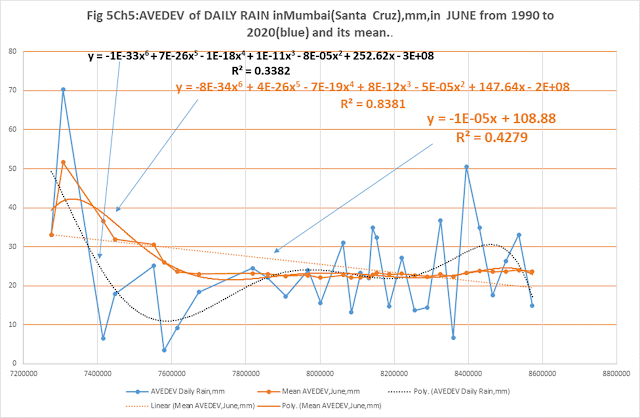
Mumbai(Santa Cruz) mean daily rainfall, mm/d is rigidly determined by Annual
World Dam Capacity as shown in Figure 6Ch6 and the other figures below. Average
deviations from the mean are controlled rigidly by the dam content changes and
the annual dam capacities.
3. Similarly,
the All India AVEDEV of Mean Daily Rainfall during June to September,
mm/d is rigidly determined by Annual World Dam Capacity as shown in Figure 6Ch6 and other figures below:
4. This
rigid determination of the characteristics of the daily rain by World Dam
Dynamics extends right till how much rain should fall on each day. The world’s
total dam content changes for each day determine the daily rain, mm/d. See the
figures below. See how as the world dam capacity builds up, the hold on the
rain by the dams goes on becoming stronger and stronger until it becomes rigid
and unbreakable.
5. See
how the control by the dams increases by leaps and bounds from 2006 to 2020:
6. See after 63 days delay how the vice like grip of World Dam Dynamics takes hold of the rain forcing it to follow rigidly for Mumbai during Monsoon 2020:
7. The
control during the monsoon is seen to hold rigidly. See how dam control is
effective during the monsoons of 2006 to 2020:
8. The
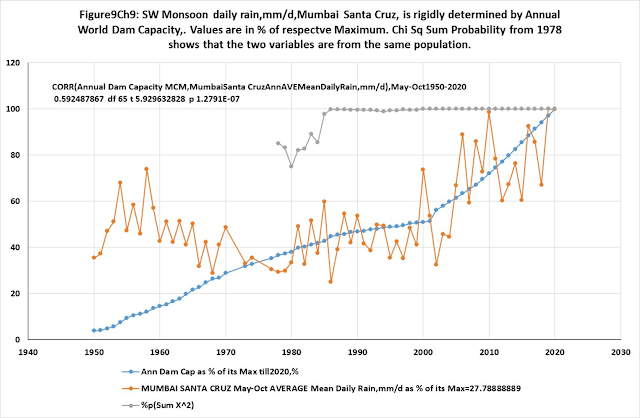
daily rain as recorded by rain gauges is rigidly controlled by the World’s
dams. See Fig 9Ch9 for the variation in the daily rain from 1950 to 2020 and
the AVERAGE DEVIATION, AVEDEV from the mean for Mumbai(Santa Cruz).
9. The All India Mean daily rain is increasing
with years in tune with world dam capacity in piecewise linear fashion. It is
in synchronism with annual sum of daily dam content change from 2006 to 2020(Figure
13Ch13).
10.
Method of Analysis
10.1
Earthquake data is used to generate daily world dam content changes(1,2,3,4).
10.2 Rainfall
data has been sourced from India Meteorological Department and associated websites.
10.3
World dam capacity has been derived from CIGRE data base from 2.
10.4
Using data generated above the described linear and non-linear correlations
have been calculated as detailed in the various figures and tables.
11. References
1. Data
for earthquakes from USGS earthquake search website and emsc-csem.org.
https://earthquake.usgs.gov/earthquakes/search/
https://www.emsc-csem.org/Earthquake/?filter=yes
2. Ramaswami
Ashok Kumar. 2015. PREDICTING EARTHQUAKES: The science of dams causing
earthquakes and climate change. Blogspot
https://predictingquakes.blogspot.com/2015/04/the-science-of-dams-causing-earthquakes.html
3. Ramaswami
Ashok Kumar. 2006. EARTHQUAKES CAUSED BY DAMS. blogspot
https://earthquakescausedbydams.blogspot.com/2006/07/title-earthquakes-caused-by-dams.html
4.
Ramaswami Ashok Kumar. 2011. Glaring Lacuna in meeting water needs. Blogspot
https://glaringlacuna.blogspot.com/2011/04/glaring-lacuna-in-meeting-water-needs.html
5.
Ramaswami Ashok Kumar.2017. PERFECT DESIGNS: Ignore root cause, get root shock-
Dams the cause of Irma's Fury. Blogspot
https://livingnormally.blogspot.com/2017/10/ignore-root-cause-get-root-shock-dams.html
6.
Ramaswami Ashok Kumar.2016. PERFECT DESIGNS: The average happiness created by
the dams of the world is zero: They are extinction breeders.Replace them with
forests.blogspot
https://livingnormally.blogspot.com/2016/05/the-average-happiness-created-by-dams.html
7. Ramaswami Ashok Kumar. 2018. PERFECT DESIGNS:
The 2018 Kerala Floods- A Disaster created by Dam Dynamics. Blogspot
https://livingnormally.blogspot.com/2018/09/the-2018-kerala-floods-disaster-created.html
8. Ramaswami
Ashok Kumar.2017. PERFECT DESIGNS: DAMS CAUSED FUKUSHIMA DAICHI TO MELT AND
EXPLODE.blogspot
https://livingnormally.blogspot.com/2017/12/dams-caused-fukushima-daichi-to-melt.html
9.
Ramaswami Ashok Kumar. 2013. Glaring
Lacuna in meeting water needs: The World's dams are causing Extinction with the
Perfect Disappearance of 2028 MW Triple Cores at Fukushima. Blogspot
https://glaringlacuna.blogspot.com/2013/10/the-worlds-dams-are-causing-extinction.html
10.
Ramaswami Ashok Kumar. 2015. collaterals of climate change. Tamilnadu flood during North
East Monsoon 2015. Blogspot
https://collateralsofclimatechange.blogspot.com/2015/11/tamilnadu-flood-during-north-east.html
10a. Ramaswami Ashok Kumar.2021. MODERN AND NORMAL CIVILIZATIONS: CLIMATE CHANGE BY DAMS: THE 26 AUGUST 2021 HURRICANE IDA WAS RIGIDLY MANOEUVRED BY WORLD DAM DYNAMICS. blogspot
https://modernandnormal.blogspot.com/2021/11/climate-change-by-dams-26-august-2021.html
11. Anja Katzenberger et al. 2021. Robust increase of Indian monsoon rainfall and its variability under future warming in CMIP6 models.
https://esd.copernicus.org/articles/12/367/2021/
12. Bibek Bhattacharya.31-07-2021. How climate change is changing the Indian monsoon
Climate change is making the monsoon more erratic and violent. Lounge speaks to experts to understand the forces shaping India's season of rains. mintLounge.
End of
article Version1. 11 May 2022. Ramaswami Ashok Kumar.


5 comments:
Re:
https://www.deccanherald.com/national/india-calls-out-the-west-says-food-grains-shouldn-t-go-the-way-of-covid-vaccines-1110601.html
Adequate not erratic rains and sensible behavior regarding life with nature as the bottomline, reforestation analogously instead of choking rivers with dams and recognizing the truth regarding climate change(more than ghgs dams are the root cause) will reform the governments so we can survive. It's not export and import everything everywhere but prospering in small self sufficient communities is the way to survive.
Re:
https://www.thehindu.com/sci-tech/energy-and-environment/watch-why-is-europe-removing-its-dams/article65453557.ece?homepage=true
See the root cause of climate change is dams. Modern civilization is committing suicide with dams. Also it is anti nature. Europe has realized that dams,nuclear power and other trash that is the society of specialists making up modern civilization must be replaced by one whose bottomline is nature.
Re:
https://www.deccanherald.com/national/east-and-northeast/never-seen-such-disaster-silchar-drowns-in-flood-28-lakh-in-cachar-remain-stuck-1120624.html
Assam area is 78438 km^2.Applying fundamental physiological principles of plants,
78438 sq km at 13kg/m^2 dry Total dry biomass density is 13x78438x10E6 kg =1019694x10^6kg=
1019694000 m^3= 1bcm per day transpired.
736.3 mm rain in 23 days from 1June to 23 Jun 2022, the total rainwater is
.7363mx78438sqkm= 58 BCM. Compare this with 23 BCM transpired.
Instead of 13 kg/ m^2 Total dry biomass density) if the dry biomass density is 2.5 fold this, the amount transpired becomes 58 BCM! Thus the floods are man-made and can we rewrite our future by analogous reforestation?
Re:https://socialgyan.in/science/madden-julian-oscillation-influencing-extreme-rainfall-in-kerala-say-cusat-researchers/amp/?unapproved=2&moderation-hash=81e6cea18c8b1168366a01f6bfc67aef&comment=2
And re: https://www.google.com/amp/s/www.thehindu.com/news/cities/Kochi/madden-julian-oscillation-influencing-extreme-rainfall-in-kerala-cusat-research/article65839996.ece/amp/
The madden julian oscillations have existed long before and during the Dam Era commencing 1900. The root cause of extremes of intra seasonal rainfall during the monsoon is the world's dams. See Ramaswami Ashok Kumar.2022. PERFECT DESIGNS: .INDIAN SW MONSOON INTRA-SEASONAL VARIABILITY IS CAUSED BY THE WORLD'S DAMS. Blogspot. Solution: see Reforest Mother Earth to Live by me.
Re: https://socialgyan.in/science/madden-julian-oscillation-influencing-extreme-rainfall-in-kerala-say-cusat-researchers/amp/
The madden-julian oscillations were always there. But dams have proliferated only from 1900. World dam dynamics above all the oscillations are the root cause of weather extremes. See my comments in this comments section above/below.
Post a Comment